What is the ELK Stack?
Data constantly flows into your systems, but it can quickly grow to be fat and stale. As your data set grows larger, your analytics will slow up, resulting in sluggish insights. And this is likely to be a serious business problem. So, the BIG question for your big data is: how can you maintain valuable business insights?
Not long ago, an epiphany ran through the industry: analytics is, in essence, a search problem that needs coupling with good visualizations. So, there was a marriage: Lucene with all its search goodness was brought together with the distributed-computing goodness that is Elasticsearch. Logstash came onto the scene to normalize all kinds of time-series data. Pop in Kibana's ultra-simple visualization tool, and you have a complete analytics tool that can rival very expensive and scalable solutions from Oracle, Palantir, Tableau, Splunk, Microsoft, and others. You, too, can play with the big boys for a lot less $$$.
Let's ask the question a bit differently. How can you maintain blazing-fast analytics as you data grows larger and larger? Answer: the ELK stack makes it way easier -- and way faster -- to search and analyze large data sets.
We should mention that ELK is quite versatile. Use the stack as a stand-alone application, or integrate with your existing applications to get the most current data. With Elasticsearch, you get all the features to make real-time decisions-all the time. You can use each of these tools separately, or with other products. For example, Kibana often goes together with Solr/Lucene. Although none of these is a project of the Apache Foundation, each part of the stack falls under the Apache 2 License. Elasticsearch owns both the intellectual property and the trademarks.
Elasticsearch — The Amazing Log Search Tool
Elasticsearch is a juggernaut solution for your data extraction problems. A single developer can use it to find the high-value needles underneath all of your data haystacks, so you can put your team of data scientists to work on another project. Consider these benefits:
Real-time data and real-time analytics. The ELK stack gives you the power of real-time data insights, with the ability to perform super-fast data extractions from virtually all structured or unstructured data sources. Real-time extraction, and real-time analytics. Elasticsearch is the engine that gives you both the power and the speed.
Scalable, high-availability, multi-tenant. With Elasticsearch, you can start small and expand it along with your business growth-when you are ready. It is built to scale horizontally out of the box. As you need more capacity, simply add another node and let the cluster reorganize itself to accommodate and exploit the extra hardware. Elasticsearch clusters are resilient, since they automatically detect and remove node failures. You can set up multiple indices and query each of them independently or in combination.
Full text search. Under the cover, Elasticsearch uses Lucene to provide the most powerful full-text search capabilities available in any open-source product. The search features come with multi-language support, an extensive query language, geolocation support, and context-sensitive suggestions, and autocompletion.
Document orientation. You can store complex, real-world entities in Elasticsearch as structured JSON documents. All fields have a default index, and you can use all the indices in a single query to get precise results in the blink of an eye.
Logstash — Routing Your Log Data
Logstash is a tool for log data intake, processing, and output. This includes virtually any type of log that you manage: system logs, webserver logs, error logs, and app logs. As administrators, we know how much time can be spent normalizing data from disparate data sources. We know, for example, how widely Apache logs differ from NGINX logs.
Rather than normalizing with time-sucking ETL (Extract, Transform, and Load), we recommend that you switch over to the fast track. Instead, you could spend much less time training Logstash to normalize the data, getting Elasticsearch to process the data, and then visualize it with Kibana. With Logstash, it's super easy to take all those logs and store them in a central location. The only prerequisite is a Java runtime, and it takes just two commands to get Logstash up and running.
Using Elasticsearch as a backend datastore and Kibana as a frontend dashboard (see below), Logstash will serve as the workhorse for storage, querying and analysis of your logs. Since it has an arsenal of ready-made inputs, filters, codecs, and outputs, you can grab hold of a very powerful feature-set with a very little effort on your part.
Think of Logstash as a pipeline for event processing: it takes precious little time to choose the inputs, configure the filters, and extract the relevant, high-value data from your logs. Take a few more steps, make it available to Elasticsearch and—BAM!—you get super-fast queries against your mountains of data.
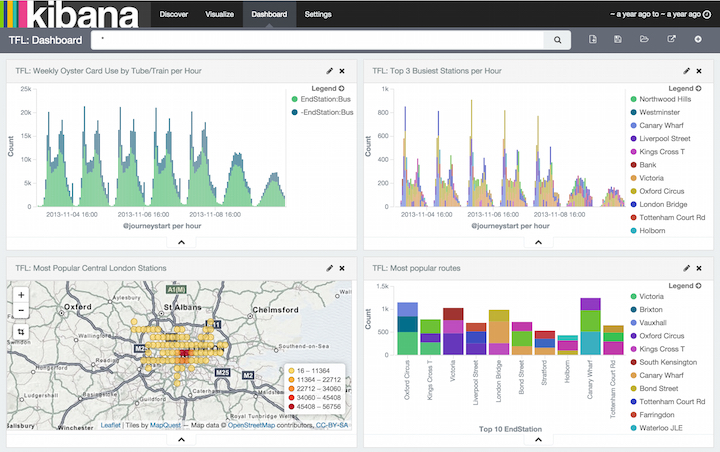
Kibana — Visualizing Your Log Data
Kibana is your log-data dashboard. Get a better grip on your large data stores with point-and-click pie charts, bar graphs, trendlines, maps and scatter plots. You can visualize trends and patterns for data that would otherwise be extremely tedious to read and interpret. Eventually, each business line can make practical use of your data collection as you help them customize their dashboards. Save it, share it, and link your data visualizations for quick and smart communication.
If you're using Qbox, then you can easily enable Kibana from your dashboard, which eliminates the need for extra infrastructure. It's too easy to setup, configure, and refine comparisons of your data queries across an adjustable time scale. Choose from several views, including interval or a rolling average.
How Can I Use the ELK Stack to Manage my Log Data?
Your critical business questions have answers in logs of your applications and systems, but most potential users of the data in those logs assume that the accessibility barrier is too high. But the answers are in there -- answers to questions such as:
- How many account signups this week?
- What is the effectiveness of our ad campaign?
- What is the best time to perform system maintenance?
- Why is my database performance slow?
The answers are in your data, but there are a number of challenges.
The Challenge of Disparate Log Data
If you're like most of us, your log data universe is inconsistent, inaccessible, and inconsistent. We understand problems such as these quite well:
No Consistency — The variety of systems and absence of standards means that it's difficult to be a jack-of-all trades.
- Logging is different for each app, system, or device
- Specific knowledge is necessary for interpreting various types of logs
- Variation in format makes it challenging to search
- Many types of time formats
No centralization — Simply put, log data is everywhere:
- Logs in many locations on various servers
- Many locations of various logs on each server
- SSH + GREP doesn’t scale or reach
Accessibility of Log Data — Much of the data is difficult to locate and manage. Although some of the log data may be highly valuable, many admins face these steep challenges:
- Access is often difficult
- High expertise to mine data
- Logs can be difficult to find
- Immense size of Log Data
The ELK stack can help you manage each of these challenges, and more. ELK is best for time-series data-anything with a time stamp-such as you'll find in most web server logs, transaction logs, and stock data listings. To be intelligible, these logs usually need substantial clean-up.
For example, you'll need to normallize in cases where you have some logs in which the timestamp is the North American
dd/mm/yy, and others are the European mm/dd/yy. Logstash handles normalizations like this and many others with ease.
Qbox is a dedicated hosting solution for Elasticsearch that aims to be as simple and intuitive as possible for the application developer. Our service is quite similar to any other cloud-hosted database. In the Qbox dashboard, simply launch your own Elasticsearch cluster—a collection of servers that functions as a node. You can add or remove any cluster on the fly, at any time.
After choosing your server size and also your options for security, plugins, and storage, Qbox will provision the cloud resources, install dependencies, attach storage drives, and lock everything down tight. Then we monitor closely and recover in the unlikely event that it's necessary. We handle all of these details so that you can focus on getting the data you need.
We've got what it takes to help you build the right search platform for your business, and all of our service offerings include fanatical technical support. You'll benefit from our deep experience in planning, deploying, and managing configurations for all kinds of companies.


0 comments:
Post a Comment